Downtime Dashboard
Events, Hours, MTBF/MTTR
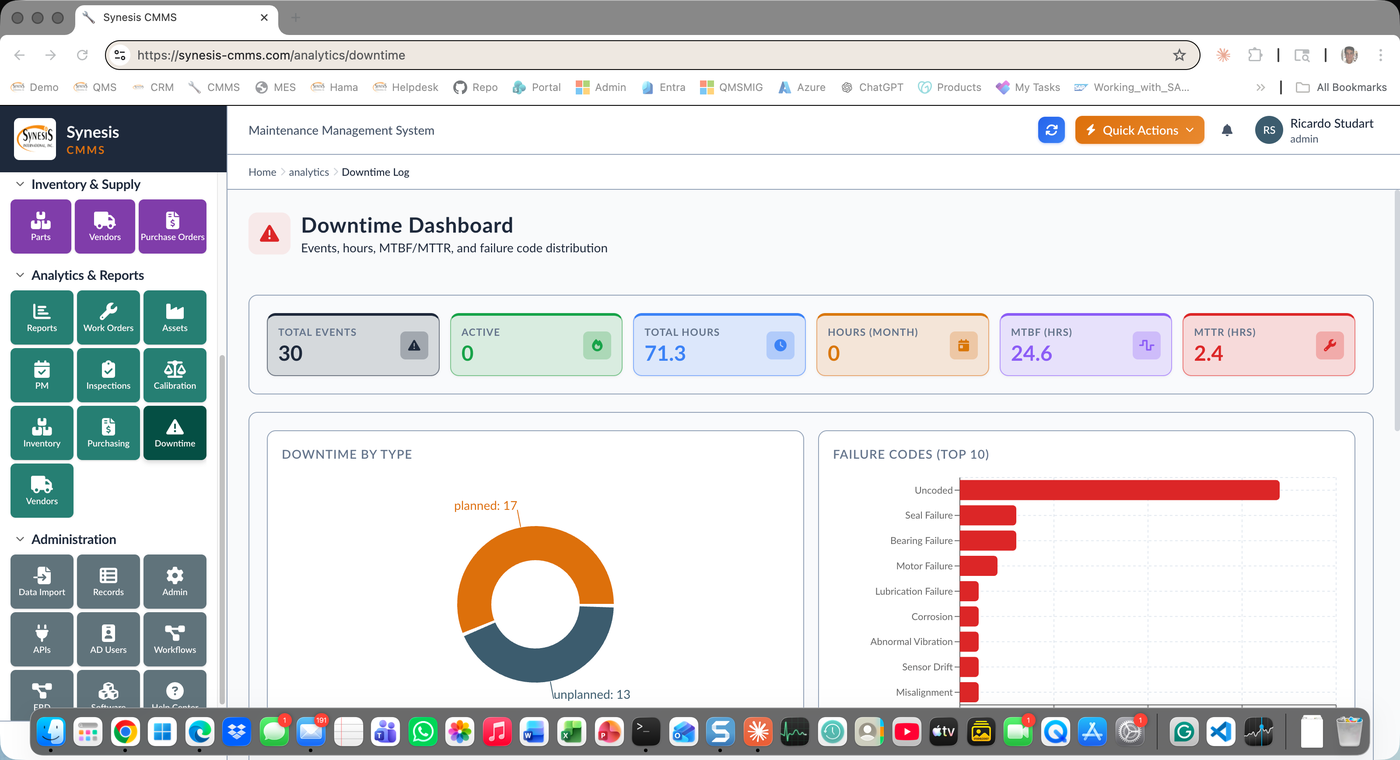
Total downtime events and hours, MTBF, MTTR, downtime by type (planned vs. unplanned), and top failure code distribution. Drill from a chart to the underlying work orders.
MTBF, MTTR, PM Compliance, Downtime Cost — All Drillable
Synesis CMMS Reports, KPI and Dashboards turn maintenance data into decisions. MTBF (mean time between failures), MTTR (mean time to repair), PM compliance, downtime cost, work order backlog, and reliability trends are computed live from the underlying work orders, assets, and labor records. Every chart, KPI, and metric is drillable: click a slice, see the records behind it. Filter, sort, and export to Excel without leaving the page.
Process dashboards are tuned per workflow. The Downtime Dashboard tracks events, hours, MTBF, MTTR, downtime by type (planned vs. unplanned), and top failure codes. The PM Dashboard tracks compliance, frequency distribution, and overdue PMs. The Asset Reliability Dashboard ranks assets by failure risk and TCO. Direct Power BI integration for organizations standardizing on Microsoft analytics.
Events, Hours, MTBF/MTTR
Total downtime events and hours, MTBF, MTTR, downtime by type (planned vs. unplanned), and top failure code distribution. Drill from a chart to the underlying work orders.
Compliance & Pipeline
PM compliance %, status distribution, frequency mix (weekly/monthly/quarterly/annual), overdue count, and due-this-week pipeline. Drill to overdue PMs by responsible technician.
Risk Ranking & TCO
Assets ranked by failure risk score, downtime hours, maintenance cost, and total cost of ownership. Identify the worst-performing assets and what it would cost to replace them.
Backlog & Throughput
Work order backlog by status, priority, age, and assigned technician. On-time completion rate. Throughput trend by week and month.
Stockouts & Dead Stock
Inventory value, stockout rate, dead stock identification (no movement in 12+ months), and reorder pipeline. Critical-parts coverage scoring.
Cost & SLA Tracking
Vendor scorecards by on-time response, work quality, cost variance, and SLA compliance. Spend by vendor, contract performance, and outstanding work.
Standard Office Outputs
Every list, dashboard, and report exports to Excel with one click. Detail records export to Word with branded letterhead. Print-friendly views for meetings and audits.
Enterprise BI
Direct Power BI connection for organizations on Microsoft analytics. Pre-built maintenance datasets and visuals. Embed in Teams, SharePoint, or the CMMS itself.
Every KPI, chart segment, and stat number is a link. Click to see the work orders, assets, and labor records behind it.
Dashboards refresh on demand or on schedule. No nightly ETL. The number you see is the number that's live.
Technicians see assigned work. Supervisors see backlog and throughput. Plant managers see reliability KPIs. Executives see TCO and capital planning. Same data, right view.
Reliability reports, compliance reports, and audit reports pull from live data with full traceability. Audit prep is minutes, not weeks.
Show us the metrics your leadership wants to see — we'll build a dashboard that drills into the data.
Request a Demo